Profilgruppen AB
STO:PROF B


| US |

|
Johnson & Johnson
NYSE:JNJ
|
Pharmaceuticals
|
| US |

|
Berkshire Hathaway Inc
NYSE:BRK.A
|
Financial Services
|
| US |

|
Bank of America Corp
NYSE:BAC
|
Banking
|
| US |

|
Mastercard Inc
NYSE:MA
|
Technology
|
| US |

|
UnitedHealth Group Inc
NYSE:UNH
|
Health Care
|
| US |

|
Exxon Mobil Corp
NYSE:XOM
|
Energy
|
| US |

|
Pfizer Inc
NYSE:PFE
|
Pharmaceuticals
|
| US |

|
Palantir Technologies Inc
NYSE:PLTR
|
Technology
|
| US |

|
Nike Inc
NYSE:NKE
|
Textiles, Apparel & Luxury Goods
|
| US |

|
Visa Inc
NYSE:V
|
Technology
|
| CN |

|
Alibaba Group Holding Ltd
NYSE:BABA
|
Retail
|
| US |

|
3M Co
NYSE:MMM
|
Industrial Conglomerates
|
| US |

|
JPMorgan Chase & Co
NYSE:JPM
|
Banking
|
| US |

|
Coca-Cola Co
NYSE:KO
|
Beverages
|
| US |

|
Walmart Inc
NYSE:WMT
|
Retail
|
| US |

|
Verizon Communications Inc
NYSE:VZ
|
Telecommunication
|
Utilize notes to systematically review your investment decisions. By reflecting on past outcomes, you can discern effective strategies and identify those that underperformed. This continuous feedback loop enables you to adapt and refine your approach, optimizing for future success.
Each note serves as a learning point, offering insights into your decision-making processes. Over time, you'll accumulate a personalized database of knowledge, enhancing your ability to make informed decisions quickly and effectively.
With a comprehensive record of your investment history at your fingertips, you can compare current opportunities against past experiences. This not only bolsters your confidence but also ensures that each decision is grounded in a well-documented rationale.
Do you really want to delete this note?
This action cannot be undone.

| 52 Week Range |
94.4934
136.7794
|
| Price Target |
|
We'll email you a reminder when the closing price reaches SEK.
Choose the stock you wish to monitor with a price alert.

|
Johnson & Johnson
NYSE:JNJ
|
US |

|
Berkshire Hathaway Inc
NYSE:BRK.A
|
US |

|
Bank of America Corp
NYSE:BAC
|
US |

|
Mastercard Inc
NYSE:MA
|
US |

|
UnitedHealth Group Inc
NYSE:UNH
|
US |

|
Exxon Mobil Corp
NYSE:XOM
|
US |

|
Pfizer Inc
NYSE:PFE
|
US |

|
Palantir Technologies Inc
NYSE:PLTR
|
US |

|
Nike Inc
NYSE:NKE
|
US |

|
Visa Inc
NYSE:V
|
US |

|
Alibaba Group Holding Ltd
NYSE:BABA
|
CN |

|
3M Co
NYSE:MMM
|
US |

|
JPMorgan Chase & Co
NYSE:JPM
|
US |

|
Coca-Cola Co
NYSE:KO
|
US |

|
Walmart Inc
NYSE:WMT
|
US |

|
Verizon Communications Inc
NYSE:VZ
|
US |
This alert will be permanently deleted.
 Profilgruppen AB
 Profilgruppen AB
Total Current Liabilities
Profilgruppen AB
Total Current Liabilities Peer Comparison
Competitors Analysis
Latest Figures & CAGR of Competitors

| Company | Total Current Liabilities | CAGR 3Y | CAGR 5Y | CAGR 10Y | ||
|---|---|---|---|---|---|---|

|
Profilgruppen AB
STO:PROF B
|
Total Current Liabilities
kr621.5m
|
CAGR 3-Years
10%
|
CAGR 5-Years
9%
|
CAGR 10-Years
N/A
|
|

|
Granges AB
STO:GRNG
|
Total Current Liabilities
kr5.9B
|
CAGR 3-Years
3%
|
CAGR 5-Years
14%
|
CAGR 10-Years
16%
|
|
Profilgruppen AB
Glance View
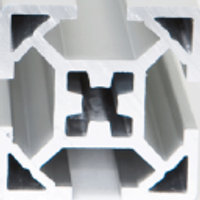
ProfilGruppen AB engages in the aluminium business. The company is headquartered in Aseda, Kronoberg and currently employs 567 full-time employees. The company offers a range of aluminum processing services, including cutting, bending, welding, surface treatment and joining. The Company’s products are applied in the field of automotive, electronics, interior design, telecommunications, as well as industry and construction. The firm primarily markets its products in Sweden, Germany, Denmark, Norway, and the United Kingdom, among others. Furthermore, It operates through a number of direct subsidiaries, such as Bergstroms Utveckling AB, ProfilGruppen Extrusions AB and ProfilGruppen Manufacturing AB, as well as through indirect subsidiaries, including ProfilGruppen Components AB, ProfilGruppen Danmark A/S, ProfilGruppen GmbH, ProfilGruppen Ltd and ProfilGruppen Norge AS.

See Also
What is Profilgruppen AB's Total Current Liabilities?
Total Current Liabilities
621.5m
SEK
Based on the financial report for Dec 31, 2023, Profilgruppen AB's Total Current Liabilities amounts to 621.5m SEK.
What is Profilgruppen AB's Total Current Liabilities growth rate?
Total Current Liabilities CAGR 5Y
9%
Over the last year, the Total Current Liabilities growth was -14%. The average annual Total Current Liabilities growth rates for Profilgruppen AB have been 10% over the past three years , 9% over the past five years .


 You don't have any saved screeners yet
